Does correlation prove that one thing caused another?
No. A correlation only describes how two columns moved in this file. Other variables, timing, missing data, and chance can affect the result.
Free, private, browser-based
Compare two numeric columns from a CSV file with private, browser-based correlation analysis and a clear visual result.
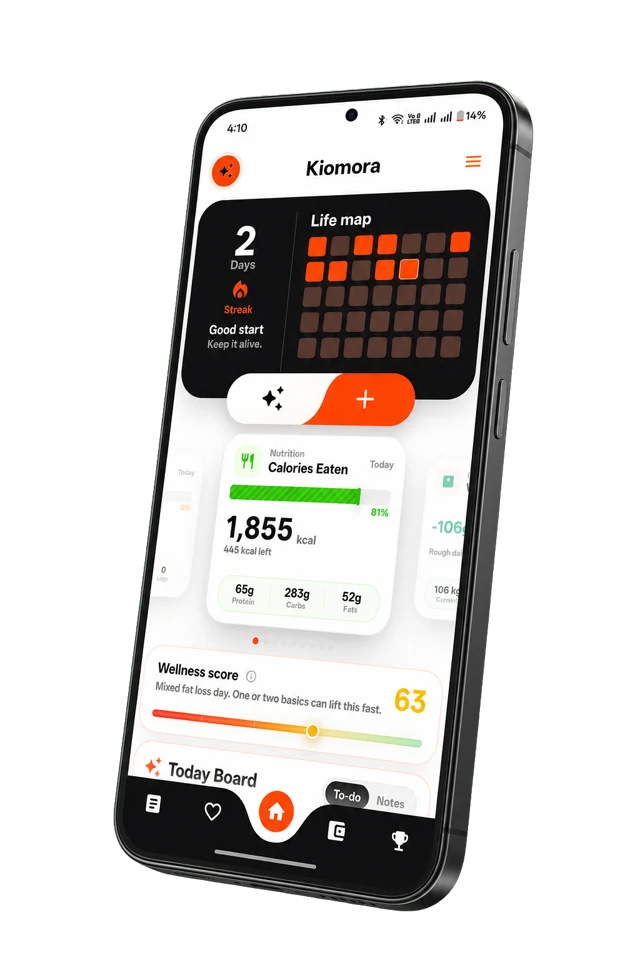
Kiomora for daily context
A calculator answers one question. Kiomora keeps the detail beside the rest of the day that shaped it.
Explore KiomoraYour entries stay here.This tool runs on your device and sends no entered data to Kiomora.
Current comparison
A strong positive relationship appears in the 14 rows where both columns contain numbers.
Average 7.26
Range 6.1 to 8.3
Average 3.5
Range 2 to 5
This result describes the selected file only. It is not a medical conclusion, prediction, or proof of cause.
Read the result carefully
Pearson correlation compares how closely two numeric columns follow a straight-line pattern. Rank correlation compares the order of the values, which can be useful when the relationship is consistent but not perfectly linear.
Neither score proves that one variable caused the other. Check the number of included rows, missing values, unusual days, and other factors before deciding whether a pattern deserves more observation.
No. A correlation only describes how two columns moved in this file. Other variables, timing, missing data, and chance can affect the result.
No. The selected file is read and analyzed inside your browser. This tool does not upload the file or save its contents.
Use a header row and at least three rows where both selected columns contain numbers. More consistent records usually make the comparison easier to interpret.
Don't forget to try Kiomora
Keep useful details from every day in one record you can review later.
Explore Kiomora